By Natalie Volk
Introduction:
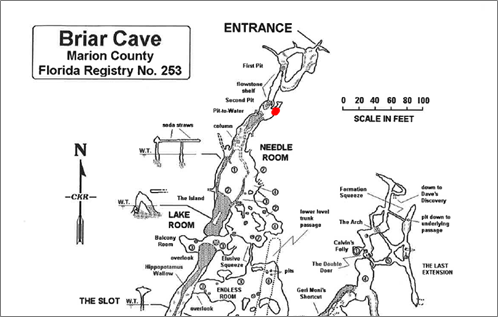
Briar cave is a beautiful formation rich cave located in north central Florida. It has significant air passage with many swimming tunnels. The cave is entirely within the fossil rich Ocala Formation and contains many iron rich mud deposits known to stain clothes and skin. It was discovered and extensively explored and mapped in the 1960s then subsequently closed by the property owners in 1972. The Florida Speleological Society (FSS) reopened, gated, and took over management in 1989. There have been previous studies at Briar cave to assess the carbon dioxide (CO2) influence on limestone dissolution, but extensive air flow and quality studies have not been conducted.
This project aimed not to be an in-depth scientific study for publication, but rather an assessment of general air quality trends within the cave and a means to provide cavers with alternative, low-cost air measuring devices to promote cave safety and inspire citizen science.
Previously, air monitoring relied on cigarette lighters carried by cavers. These were great low cost and readily available devices, but they lacked precision and were prone to failure if submerged in a water passage or handled with wet hands. Lighters also cannot test for CO2. Many of the symptoms commonly reported at Briar (headaches, dizziness, shortness of breath) are more closely associated with concentrations of high CO2 rather than low oxygen (O2). Low O2 and elevated CO₂ levels in confined spaces like caves pose serious health and safety risks. Oxygen levels below 19.5% are considered unsafe and can lead to symptoms such as dizziness, confusion, impaired judgment, and loss of consciousness. Due to the remote nature of caves and the presence of water, a toxic atmosphere poses an even greater risk. High concentrations of CO₂ can exacerbate these effects, causing rapid breathing, headache, and in extreme cases, unconsciousness or death. Because CO₂ is heavier than air, it tends to accumulate in low-lying areas, making caves especially susceptible. Plans to develop an air monitoring program for Briar began in 2024.
Project Parts and Plan:
The “cave canary” was designed and developed for this project. Two different types of CO2 sensors were implemented: the SCD41, a photoacoustic NDIR sensor, and the SCD30, an IR sensor. An electrochemical oxygen sensor was used for comparison with the lighter test and to provide redundancy. The electronics were originally housed in a Tupperware container purchased at the Briar Publix then moved to a 3D printed housing with a Pelican case for durability.
A total of 13 air monitoring trips were conducted from March 2024 through February 2026. There were no trips in August 2025 due to very low oxygen levels observed during the June 2025 trip. Air readings were displayed live on an LCD during the trip and automatically saved to an SD card every minute. Readings from the September 2025 trip were estimated based on the LCD readout, due to an SD card failure. Water level measurements from the staff gauge in the lake room were also collected on each trip.
Data and Discussion:
Monthly Trips:
Monthly rainfall data from the Ocala International Airport weather station was obtained and correlated with cave water levels and air quality. As previous trips have observed, air quality significantly drops in the summer months.
Monthly trips showed an inverse relationship between CO2 and O2. In the warmer summer months, the CO2 increased and the O2 decreased, and vice versa in the winter months. Hurricane Helene recharged the cave dramatically, and unseasonably high water levels were observed during the January 2025 trip. The air quality was “good” during this trip with O2 reaching a minimum of “only” 19.6%. The southern area opened around 5’ 4” on the staff gauge and air quality dropped when this was observed in April 2025. As water levels continued to drop air quality slightly improved in the southern section, but it always remained at very high CO2 levels (~30,000 ppm).
The worst air was observed on the April 2025 trip when the southern section first opened for the season. Oxygen readings were 16.5% and CO2 was observed at 38,970 ppm. Cavers immediately left the area as air quality was immediately dangerous to life or health (IDLH). OSHA considers any O2 concentration <19.5% an oxygen deficient atmosphere, and NIOSH considers 40,000 ppm of CO2 IDLH. Typical outdoor concentrations are approximately 21% O2 and 500 ppm of CO2. A few minutes of exposure to CO2 at concentrations >70,000 ppm or O2 at ~10% produces unconsciousness. Briar has both extremely high levels of CO2 and low levels of oxygen making for a dangerous combination.
As expected, the worst air was always observed in the southern section and the best air was always observed in the entrance room. A summary of data collected during monthly monitoring trips is presented in the charts below.
Time Series Data:
An additional “long-term” air logger was also built. This utilized the SCD41 chip to log CO2, Temperature, and Humidity readings every minute. A 12V battery pack, previously developed to power a projector for cave movie nights was used to power the logger for approximately 3 weeks.
The long-term logger was deployed after the entrance squeeze in November 2025 and in January 2026. A case was designed to house the logger electronics and battery pack to protect from mice, bugs, and condensation. As with most caves, condensation was a big concern in Briar as it can be detrimental to electronics.
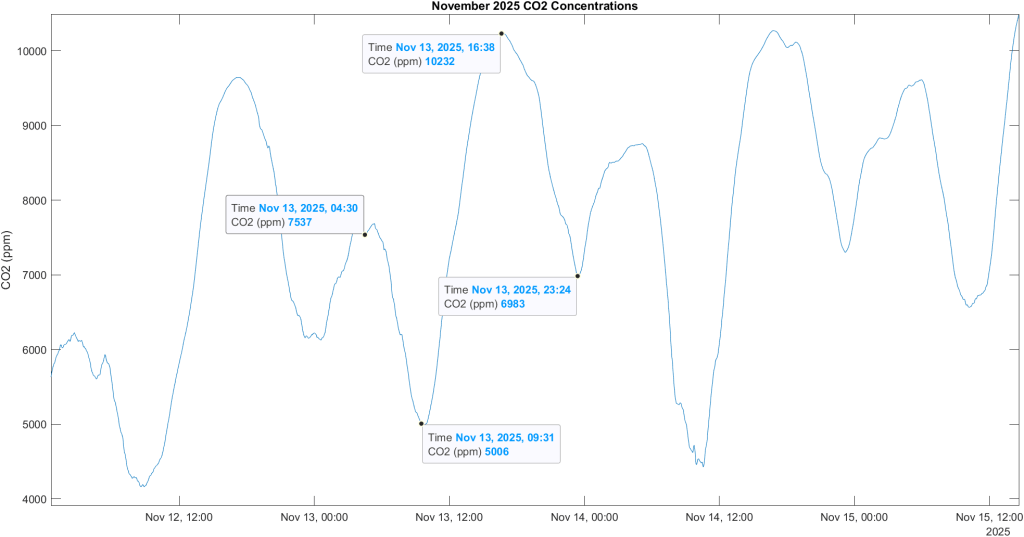
The time series data gave a detailed look at how the cave “breathes” each day. CO2 peaks were consistently observed twice a day around 4 am and 4 pm. CO2 valleys occurred daily around 9 am and midnight.
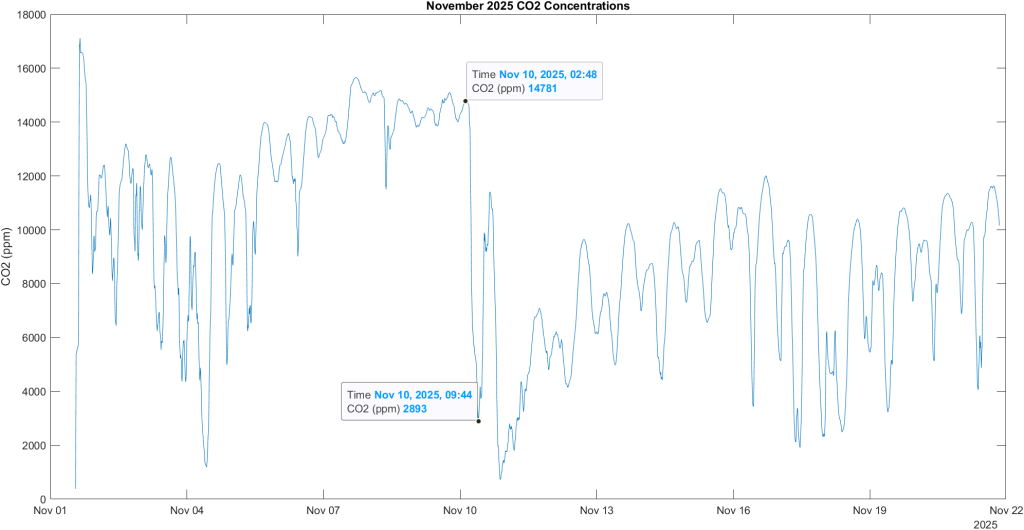
Over the sampling period of 3 weeks, a cold front was observed on November 10th. This event moved a large amount of air in the cave and CO2 concentrations dropped from 14,000 to 2,800 ppm. Even during the cold fronts there were still two daily highs and lows observed.
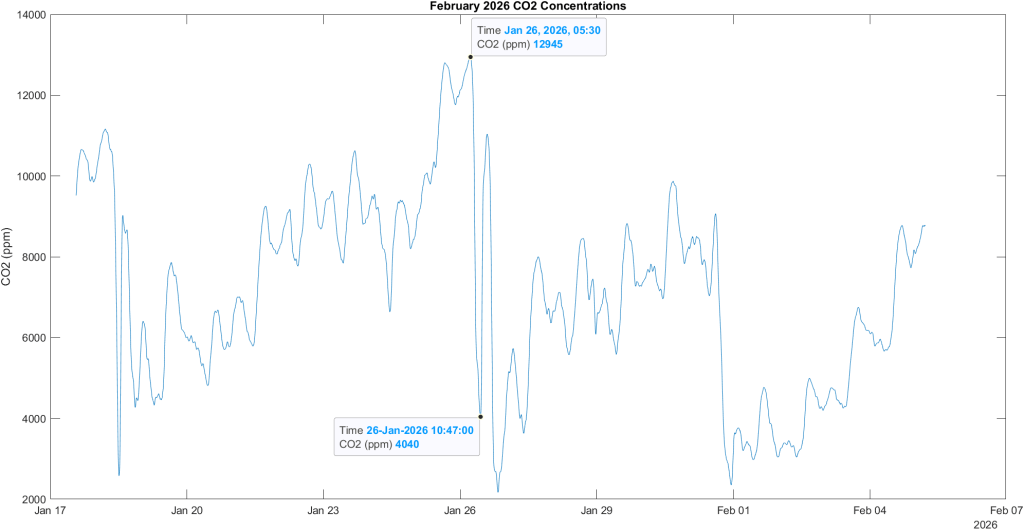
In January and February there was a higher frequency of cold fronts with the largest air exchange occurring on January 26. Another cold front occurred on January 31st. This was an historic freeze for Florida.
Temperature Swings During Cold Fronts (°F)
| High | Low | Temperature Swing | |
| January 15 | 56 | 36 | 20 |
| January 26 | 72 | 37 | 35 |
| January 31 | 56 | 28 | 28 |
Water Testing:
On two trips (September and November 2025), dissolved oxygen (DO) readings were collected from the water in the lake room. DO was higher in summer months and lower in the winter months which inversely correlated with the oxygen concentrations seen in the air. Water pH was 6.82 in September. Temperature was consistently 76°
Water Readings and Correlating Trip Air Readings
| DO (mg/L) | O2 (%) | CO2 (ppm) | Water Level (ft) | |
| September 2025 | 4.40 | 17.3 | 28,000 | 6.21 |
| November 2025 | 1.34 | 19.2 | 18,050 | 5.78 |
Conclusions:
Briar cave has a seasonal variation in air quality with winter months having the best air quality and summer months having the worst air quality. Large temperature swings outside the cave help air exchange near the entrance of the cave, but air exchange near the southern section has not been studied. Lighter tests were highly variable depending on brand, and oxygen was already at an “unsafe” level when effects on lighter flames were seen.
A word of warning: Many Florida caves are unique in that you can swim in crystal clear relatively warm aquifer water. Water table caves seem to pose a greater risk of “bad air” in the summer months and in poorly ventilated areas. Be aware of cave ventilation and seasons/rainfall. Take extra caution if you are performing duck-unders and sump hoping without additional air supply. You should always know what you are breathing.
Acknowledgements:
Thanks to everyone who has helped with air monitoring trips.
Special thanks to Mike who helped with the hardware selection, code debugging, and case designs.
Sources and Additional Reading:
Briar Cave History and Exploration:
Florida Speleologist: Volume 27, Number 2. Summer 1990.
Bad air in caves, NSS:
